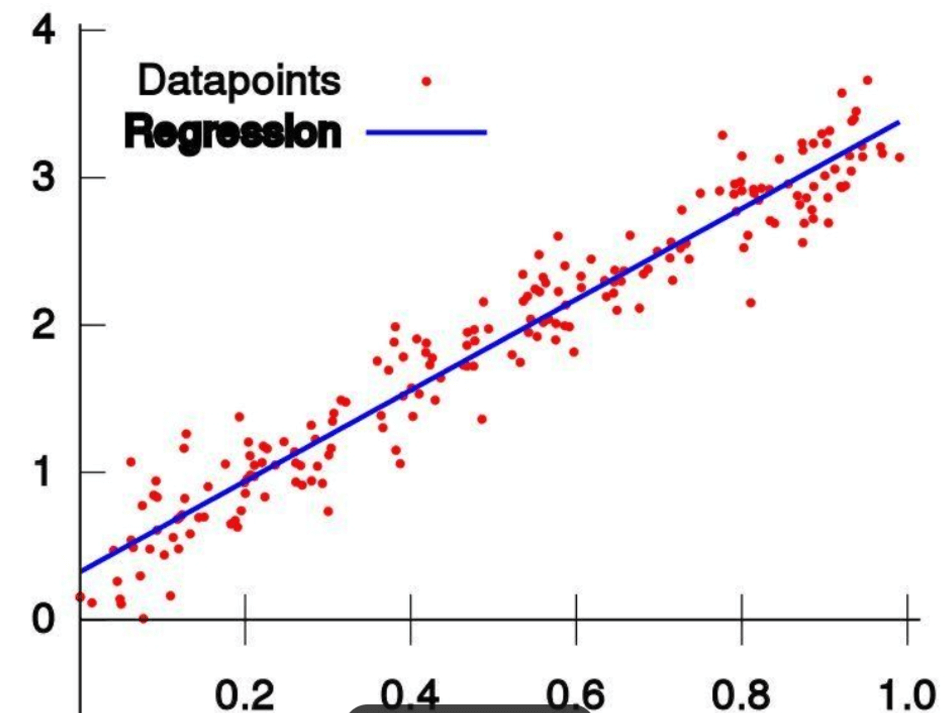
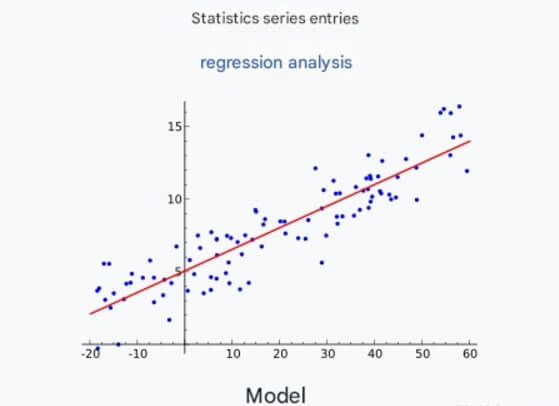
Regression analysis is a widely used technique in statistics and machine learning, primarily used to model the relationship between dependent and independent variables. In practical applications, regression analysis can not only help us understand data but also make effective predictions. This article will delve into the basic concepts of regression analysis, common regression algorithms, application scenarios, and how to implement regression models using Python.
1. What is Regression Analysis?
Regression analysis aims to describe the relationship between one variable (the dependent or response variable) and one or more other variables (independent or explanatory variables). Its basic goal is to construct a mathematical model from data to predict the value of the dependent variable given the independent variables.
1.1 Linear Regression
Linear regression is the basic form of regression analysis, assuming a linear relationship between the dependent and independent variables. The linear regression model can be expressed as:
y: Dependent variable
β0: Intercept
β1, β2, ..., βn: Coefficients of the independent variables
x1, x2, ..., xn: Independent variables
ϵ: Error term

By minimizing the sum of squared errors, linear regression finds the best-fitting line, minimizing the error between predicted and actual values.
1.2 Nonlinear Regression
Nonlinear regression is used when there is a nonlinear relationship between the dependent and independent variables. Common nonlinear models include polynomial regression, logarithmic regression, and exponential regression. These models typically require choosing an appropriate function to fit the data.
2. Common Regression Algorithms
2.1 Simple Linear Regression
Simple linear regression is the most basic method of regression analysis, involving only one independent variable. Its core idea is to find the optimal coefficients using the least squares method.
2.2 Multiple Linear Regression
Multiple linear regression extends simple linear regression to handle multiple independent variables, still using the least squares method to fit the data. This method is especially important when dealing with high-dimensional data.
2.3 Ridge and Lasso Regression
When performing multiple linear regression, multicollinearity can arise, leading to model instability. Ridge and lasso regression solve this issue through regularization techniques:
Ridge Regression: Adds an L2 regularization term to penalize large coefficients, reducing model complexity.
Lasso Regression: Adds an L1 regularization term, which shrinks some coefficients to zero, achieving feature selection.
2.4 Logistic Regression
Although logistic regression is used for classification problems, its foundational idea is similar to linear regression. By using a logistic function (Sigmoid function), it maps a linear combination to probability values.
3. Application Scenarios
Regression analysis has important applications in various fields:
Economics: Predicting economic indicators, such as GDP and unemployment rate.
Healthcare: Analyzing health data to predict the likelihood of diseases.
Marketing: Evaluating the impact of advertising expenditure on sales.
Engineering: Analyzing the relationship between product performance and design variables.
4. How to Implement Regression Analysis in Python
4.1 Data Preparation
We will use the Scikit-learn and Pandas libraries to implement linear regression. First, import the necessary libraries and create a sample dataset.
import pandas as pd
import numpy as np
import matplotlib.pyplot as plt
from sklearn.model_selection import train_test_split
from sklearn.linear_model import LinearRegression
from sklearn.metrics import mean_squared_error, r2_score

# Sample dataset
data = {
    'Area': [50, 60, 70, 80, 90, 100, 110, 120, 130, 140],
    'Price': [150, 180, 210, 240, 270, 300, 330, 360, 390, 420]
}

df = pd.DataFrame(data)
4.2 Data Visualization
Before building the model, visualize the data to understand its distribution.
plt.scatter(df['Area'], df['Price'])
plt.title('Relationship between House Price and Area')
plt.xlabel('Area (square meters)')
plt.ylabel('Price (10,000 yuan)')
plt.grid(True)
plt.show()
4.3 Splitting the Dataset
Split the dataset into training and testing sets for model evaluation.
X = df[['Area']]
y = df['Price']

X_train, X_test, y_train, y_test = train_test_split(X, y, test_size=0.2, random_state=42)
4.4 Training the Model
Train the model using linear regression.
model = LinearRegression()
model.fit(X_train, y_train)
4.5 Making Predictions
Use the test set to make predictions and evaluate the model performance.
y_pred = model.predict(X_test)

# Calculate mean squared error and R² score
mse = mean_squared_error(y_test, y_pred)
r2 = r2_score(y_test, y_pred)

print(f'Mean Squared Error: {mse:.2f}')
print(f'R² Score: {r2:.2f}')
4.6 Visualizing the Regression Line
Finally, visualize the predicted results with the original data and observe the relationship between the regression line and data points.
plt.scatter(X, y, color='blue', label='Actual Data')
plt.plot(X_test, y_pred, color='red', linewidth=2, label='Regression Line')
plt.title('House Price Regression Analysis')
plt.xlabel('Area (square meters)')
plt.ylabel('Price (10,000 yuan)')
plt.legend()
plt.grid(True)
plt.show()
5. Conclusion
Regression analysis is an important tool in machine learning, helping us understand the relationships between variables and make effective predictions. With a simple Python implementation, we can quickly start with regression analysis and apply it to real-world problems.
In future studies, you can explore more complex regression models and techniques, such as time series analysis, cross-validation, hyperparameter tuning, etc. Continuous practice and application will help you progress further in the fields of data analysis and machine learning.
I hope this blog provides you with a detailed understanding of regression analysis and practical implementation steps to succeed in your machine learning journey! If you have any questions or would like to discuss further, feel free to join the discussion in the comments section.


