Explore the annual revenue and workforce statistics of 20 leading chip companies, including NVIDIA, Intel, AMD, and TI. Discover insights on fabless vs. IDM efficiency, EDA profitability, and the growing focus on the Chinese market.
Recently, during discussions with industry professionals, EEWorld discovered that many people are unaware of how much revenue the major chip companies generate annually or how many employees they have.
With the end of the year approaching, many chip companies have started releasing their financial reports. As most Q1-Q3 reports are already available, the data provides a reliable snapshot of their annual performance. Today, we’re reviewing 20 leading chip giants to analyze their industry positions and workforce statistics over the past year.
The Companies in Focus
The analysis includes 20 representative companies: NVIDIA, Intel, Broadcom, Qualcomm, Micron, AMD, Infineon, TI, STMicroelectronics, NXP, Renesas, ADI, ON Semiconductor, Synopsys, Microchip, Marvell, Cadence, Qorvo, Arm, Rohm, and MPS. These companies were selected based on their significance in digital, analog, storage, and EDA/IP domains.
All data is derived from public sources. Revenue figures come from either disclosed financial reports or forecasts based on past quarterly performance from research institutions. Employee numbers are based on the latest available reports and are provided for reference only.

Key Insights
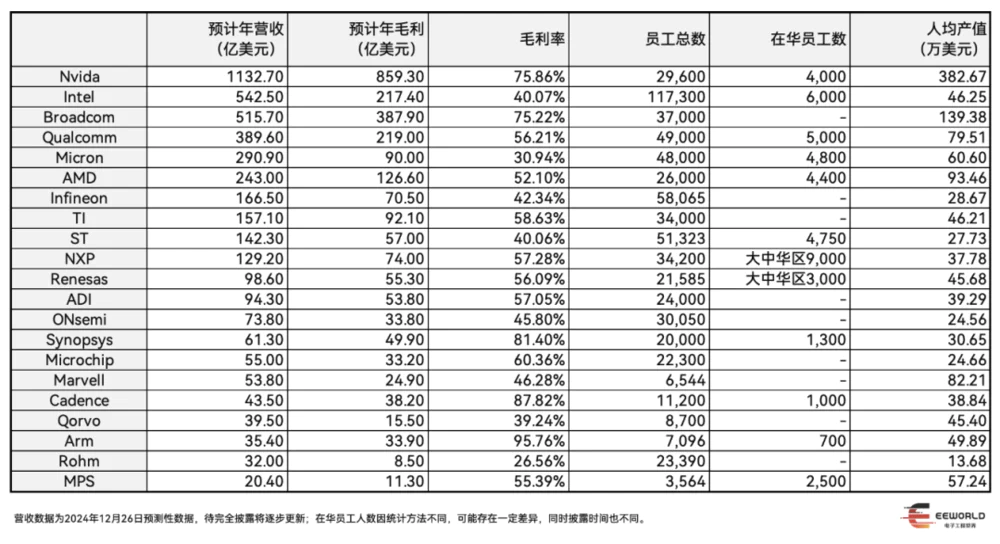
Fabless Companies Excel in Per Capita Output
Companies like NVIDIA, AMD, and Broadcom have significantly higher per-employee revenue compared to IDM (Integrated Device Manufacturer) companies. This is largely due to the booming demand for AI, which has driven remarkable revenue growth over the past year. Marvell also had a stellar performance, with its stock price soaring by 90% over the year, reflecting its high per-capita productivity.Analog IDM: Efficiency and Scale
In the analog IDM category, Texas Instruments (TI) and Analog Devices (ADI) stand out. TI leverages its economies of scale to reduce costs, making it a highly competitive player in the market. Meanwhile, ADI’s flexible IDM model has proven to be a significant advantage. However, it's important to note that per-capita revenue is just one metric; balancing efficiency and workforce scale is key to sustained growth.Digital IDM: Intel's Surprising Efficiency
Despite its large revenue, Intel also boasts high per-capita productivity, which might seem counterintuitive. However, over the years, Intel has struggled with marketing itself effectively, leading to underwhelming stock performance. Meanwhile, its substantial investments in fabs have added to its operational costs.EDA and IP: High Margins, High Rewards
The EDA and IP sector remains incredibly lucrative, with companies like Arm, Synopsys, and Cadence maintaining high profit margins.Focus on the Chinese Market
Analyzing employee distribution reveals that Western companies are heavily invested in the Chinese market. Over the years, they’ve doubled down on "China for China" strategies, reinforcing their presence in this critical market.
Summary Table
Below is the compiled data on revenue, employees, and per-capita output. It showcases the competitive landscape and diverse strategies adopted by the industry leaders. While some prioritize workforce scale, others focus on maximizing efficiency per employee. These differences reflect varying approaches to achieving market dominance.
Stay tuned for more in-depth analyses and year-end insights from the chip industry! 🌐📊


