14.1 Logs and Breakpoints
1. The debugger() Statement
When using the Dart Observatory (or another Dart debugger, such as the one in IntelliJ IDE), you can insert programmatic breakpoints using the debugger() statement. To use this, you must add import 'dart:developer'; at the top of the relevant file.
The debugger() statement takes an optional when parameter, allowing us to specify that the breakpoint should only be triggered when certain conditions are true, as shown below:
void someFunction(double offset) {
  debugger(when: offset > 30.0);
  // ...
}
2. print, debugPrint, and flutter logs
The Dart print() function outputs to the system console, which can be viewed using flutter logs (basically a wrapper around adb logcat).
If too many logs are printed at once, Android sometimes drops some log lines. To avoid this, we can use debugPrint() from Flutter's foundation library, which wraps print and limits the length of output per call (if the content is too long, it outputs in batches), preventing it from being dropped by the Android kernel.
Many classes in the Flutter framework have a toString implementation, which, by convention, outputs information including the runtime type of the object, the class name, and key fields. Some classes in the tree also have a toStringDeep implementation that provides a multiline description of the entire subtree from that point. Some classes with detailed toString implementations may implement a toStringShort that returns only the type of the object or a very brief description (one or two words).
3. Assertions in Debug Mode
During debugging of Flutter applications, Dart assert statements are enabled, and the Flutter framework uses them to perform many runtime checks to verify that some immutable rules are not violated. When a rule is violated, an error log is printed to the console with some contextual information to help trace the root of the problem.
To disable debug mode and run in release mode, use flutter run --release to run our application. This also turns off the Observatory debugger. An intermediate mode, called "profile mode," can be used to turn off all debugging aids except for Observatory by replacing --release with --profile.
4. Breakpoints
During development, breakpoints are one of the most practical debugging tools. Taking Android Studio as an example, as shown in Figure:
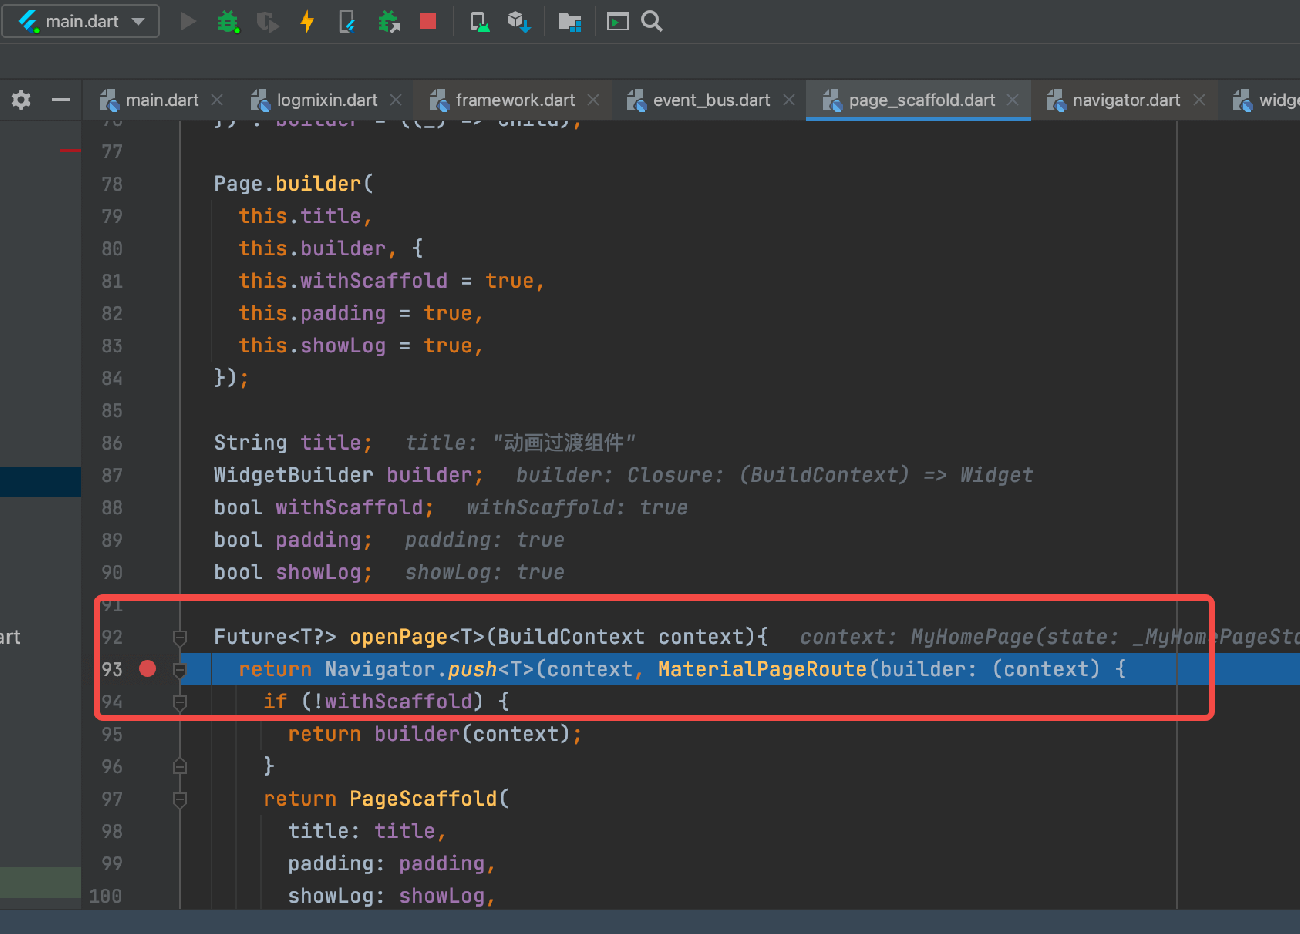
We set a breakpoint at line 93; once the code execution reaches this line, it will pause, allowing us to see the values of all variables in the current context, after which we can choose to step through the code. There are many online tutorials on how to set breakpoints through the IDE; readers can search for them.
14.2 Debugging Application Layers
Every layer in the Flutter framework provides functionality to dump its current state or events to the console (using debugPrint).
1. Widget Tree
To dump the state of the Widgets tree, call debugDumpApp(). As long as the application has been built at least once (i.e., any time after calling build()), we can call this method at any time when the application is not in the building phase (i.e., not within the build() method) after calling runApp().
For example, this application:
import 'package:flutter/material.dart';

void main() {
  runApp(
    MaterialApp(
      home: AppHome(),
    ),
  );
}

class AppHome extends StatelessWidget {
  @override
  Widget build(BuildContext context) {
    return Material(
      child: Center(
        child: TextButton(
          onPressed: () {
            debugDumpApp();
          },
          child: Text('Dump App'),
        ),
      ),
    );
  }
}
...will output content like this (the exact details may vary based on the framework version, device size, etc.):
I/flutter ( 6559): WidgetsFlutterBinding - CHECKED MODE
I/flutter ( 6559): RenderObjectToWidgetAdapter<RenderBox>([GlobalObjectKey RenderView(497039273)]; renderObject: RenderView)
I/flutter ( 6559): └MaterialApp(state: _MaterialAppState(1009803148))
I/flutter ( 6559):  └ScrollConfiguration()
I/flutter ( 6559):   └AnimatedTheme(duration: 200ms; state: _AnimatedThemeState(543295893; ticker inactive; ThemeDataTween(ThemeData(Brightness.light Color(0xff2196f3) etc...) → null)))
I/flutter ( 6559):    └Theme(ThemeData(Brightness.light Color(0xff2196f3) etc...))
I/flutter ( 6559):     └WidgetsApp([GlobalObjectKey _MaterialAppState(1009803148)]; state: _WidgetsAppState(552902158))
I/flutter ( 6559):      └CheckedModeBanner()
I/flutter ( 6559):       └Banner()
I/flutter ( 6559):        └CustomPaint(renderObject: RenderCustomPaint)
I/flutter ( 6559):         └DefaultTextStyle(inherit: true; color: Color(0xd0ff0000); family: "monospace"; size: 48.0; weight: 900; decoration: double Color(0xffffff00) TextDecoration.underline)
I/flutter ( 6559):          └MediaQuery(MediaQueryData(size: Size(411.4, 683.4), devicePixelRatio: 2.625, textScaleFactor: 1.0, padding: EdgeInsets(0.0, 24.0, 0.0, 0.0)))
I/flutter ( 6559):           └LocaleQuery(null)
I/flutter ( 6559):            └Title(color: Color(0xff2196f3))
... # Remaining content omitted
This is a "flattened" tree showing all widgets projected through various build functions (this is the tree you get if you call toStringDeep on the widget tree's root). You will see many widgets that do not appear in your application's source code because they are inserted by the build functions of widgets in the framework. For example, InkFeature is an implementation detail of Material widgets.
When the button transitions from pressed to released, debugDumpApp() is called, and the TextButton object simultaneously calls setState() and marks itself as "dirty." We can also check which gesture listeners are registered; in this case, a single GestureDetector is listed, listening for the "tap" gesture (the output of the toStringShort function of TapGestureDetector).
If we write our own widget, we can add information by overriding debugFillProperties(). Pass a DiagnosticsProperty object as a method parameter and call the parent class method. This function is used by the toString method to fill in widget description information.
2. Render Tree
If we are trying to debug layout issues, the Widget tree may not provide enough detail. In this case, we can dump the render tree by calling debugDumpRenderTree(). As with debugDumpApp(), we can call this function at any time except during the layout or painting phase. As a general rule, calling it from a frame callback or event handler is the best practice.
To call debugDumpRenderTree(), we need to add import 'package:flutter/rendering.dart'; to our source file.
The output of the small example above looks like this:
I/flutter ( 6559): RenderView
I/flutter ( 6559):  │ debug mode enabled - android
I/flutter ( 6559):  │ window size: Size(1080.0, 1794.0) (in physical pixels)
I/flutter ( 6559):  │ device pixel ratio: 2.625 (physical pixels per logical pixel)
I/flutter ( 6559):  │ configuration: Size(411.4, 683.4) at 2.625x (in logical pixels)
I/flutter ( 6559):  │
I/flutter ( 6559):  └─child: RenderCustomPaint
I/flutter ( 6559):    │ creator: CustomPaint ← Banner ← CheckedModeBanner ←
I/flutter ( 6559):    │   WidgetsApp-[GlobalObjectKey _MaterialAppState(1009803148)] ←
I/flutter ( 6559):    │   Theme ← AnimatedTheme ← ScrollConfiguration ← MaterialApp ←
I/flutter ( 6559):    │   [root]
I/flutter ( 6559):    │ parentData: <none>
I/flutter ( 6559):    │ constraints: BoxConstraints(w=411.4, h=683.4)
I/flutter ( 6559):    │ size: Size(411.4, 683.4)
... # Omitted
This is the output from the root RenderObject's toStringDeep function.
When debugging layout issues, the key fields to examine are size and constraints. Constraints are passed down the tree, while sizes are passed up.
If we write our own render objects, we can add information to the dump by overriding debugFillProperties(). Pass a DiagnosticsProperty object as a method parameter and call the parent class method.
3. The Layer Tree
The layer tree can be understood as the rendering tree being split into different layers, which are eventually composed together for rendering. Layers represent the parts of the app that need to be composited during rendering. If we want to debug composition issues, we can use the debugDumpLayerTree() method. For the example above, it outputs:
I/flutter : TransformLayer
I/flutter :  │ creator: [root]
I/flutter :  │ offset: Offset(0.0, 0.0)
I/flutter :  │ transform:
I/flutter :  │   [0] 3.5,0.0,0.0,0.0
I/flutter :  │   [1] 0.0,3.5,0.0,0.0
I/flutter :  │   [2] 0.0,0.0,1.0,0.0
I/flutter :  │   [3] 0.0,0.0,0.0,1.0
I/flutter :  │
I/flutter :  ├─child 1: OffsetLayer
I/flutter :  │ │ creator: RepaintBoundary ← _FocusScope ← Semantics ← Focus-[GlobalObjectKey MaterialPageRoute(560156430)] ← _ModalScope-[GlobalKey 328026813] ← _OverlayEntry-[GlobalKey 388965355] ← Stack ← Overlay-[GlobalKey 625702218] ← Navigator-[GlobalObjectKey _MaterialAppState(859106034)] ← Title ← ⋯
I/flutter :  │ │ offset: Offset(0.0, 0.0)
I/flutter :  │ │
I/flutter :  │ └─child 1: PictureLayer
I/flutter :  │
I/flutter :  └─child 2: PictureLayer
This is the output from the toStringDeep method of the root Layer.
The transformation at the root applies the device pixel ratio; in this case, each logical pixel corresponds to 3.5 device pixels.
The RepaintBoundary widget creates a RenderRepaintBoundary in the rendering tree. This is used to reduce the amount of re-rendering needed.
4. Semantics
We can also call debugDumpSemanticsTree() to get a dump of the semantics tree, which is the tree presented to system accessibility APIs. To use this feature, you must first enable accessibility, such as by enabling system assistive tools or using the SemanticsDebugger (discussed below).
For the example above, it outputs:
I/flutter : SemanticsNode(0; Rect.fromLTRB(0.0, 0.0, 411.4, 683.4))
I/flutter :  ├SemanticsNode(1; Rect.fromLTRB(0.0, 0.0, 411.4, 683.4))
I/flutter :  │ └SemanticsNode(2; Rect.fromLTRB(0.0, 0.0, 411.4, 683.4); canBeTapped)
I/flutter :  └SemanticsNode(3; Rect.fromLTRB(0.0, 0.0, 411.4, 683.4))
I/flutter :    └SemanticsNode(4; Rect.fromLTRB(0.0, 0.0, 82.0, 36.0); canBeTapped; "Dump App")
5. Scheduling
To track the timing of events relative to frame start/end, you can toggle the boolean values debugPrintBeginFrameBanner and debugPrintEndFrameBanner to print the start and end of each frame to the console.
For example:
I/flutter : ▄▄▄▄▄▄▄▄ Frame 12         30s 437.086ms ▄▄▄▄▄▄▄▄
I/flutter : Debug print: Am I performing this work more than once per frame?
I/flutter : Debug print: Am I performing this work more than once per frame?
I/flutter : ▀▀▀▀▀▀▀▀▀▀▀▀▀▀▀▀▀▀▀▀▀▀▀▀▀▀▀▀▀▀▀▀▀▀▀▀▀▀▀▀▀▀▀▀▀▀▀▀▀▀▀
The debugPrintScheduleFrameStacks method can also be used to print the call stack that caused the current frame to be scheduled.
6. Visual Debugging
We can visually debug layout issues by setting debugPaintSizeEnabled to true. This is a boolean flag in the rendering library. It can be enabled at any time, and when set to true, it affects the drawing of widgets. The easiest way to enable it is to set it at the top of the void main() function.
When enabled, all boxes get a bright cyan border, padding (from widgets like Padding) is shown in light blue, and child widgets are enclosed by a dark blue border. Alignment (from widgets like Center and Align) is represented by yellow arrows. Empty spaces (e.g., a Container without children) are displayed in gray.
debugPaintBaselinesEnabled works similarly, but for objects with baselines. Text baselines are shown in green, and ideographic baselines are shown in orange.
The debugPaintPointersEnabled flag highlights any objects currently being touched in cyan. This can help identify if a widget is incorrectly hit-tested (e.g., if it’s actually out of bounds of its parent and shouldn’t be hit-tested).
If you’re debugging compositing layers, such as determining where to add RepaintBoundary widgets, you can use the debugPaintLayerBordersEnabled flag, which outlines each layer’s borders in orange or highlights layers with an overlay. You can also use debugRepaintRainbowEnabled to color layers with rotating colors whenever they repaint.
All these flags only work in debug mode. Generally, anything in Flutter prefixed with debug... only functions in debug mode.
7. Debugging Animations
The simplest way to debug animations is to slow them down. To do this, set the timeDilation variable (from the scheduler library) to a number greater than 1.0, such as 50.0. It’s best to set this at the start of the app. If changed mid-execution, especially while an animation is running, it might cause glitches, including hitting assertions and interrupting development.
8. Debugging Performance Issues
To understand what’s causing our app to trigger re-layout or repaint events, we can set debugPrintMarkNeedsLayoutStacks and debugPrintMarkNeedsPaintStacks. These will log the call stack to the console whenever a render box is marked for re-layout or repaint. If this is helpful, we can use the debugPrintStack() method from the services library to print a stack trace on demand.
9. Measuring App Startup Time
To gather detailed information on the time it takes for a Flutter app to start, you can use the trace-startup and profile options when running the app via flutter run:
$ flutter run --trace-startup --profile
The trace output is saved as start_up_info.json in the build directory under the Flutter project. The output lists the time taken (in microseconds) for the following startup events:
Entering the Flutter engine.
Showing the first frame of the app.
Initializing the Flutter framework.
Completing the Flutter framework initialization.
For example:
{
  "engineEnterTimestampMicros": 96025565262,
  "timeToFirstFrameMicros": 2171978,
  "timeToFrameworkInitMicros": 514585,
  "timeAfterFrameworkInitMicros": 1657393
}
10. Tracking Dart Code Performance
To track custom performance and measure the wall or CPU time of any arbitrary segment of Dart code (similar to using systrace on Android), use the Timeline tool from the dart:developer library to wrap the code you want to profile. For example:
Timeline.startSync('interesting function');
// iWonderHowLongThisTakes();
Timeline.finishSync();
Then open the Observatory timeline page for your app, select the "Dart" checkbox under "Recorded Streams," and execute the function you want to measure.
Refreshing the page will display a timeline of the recorded events in the Chrome tracing tool.
Ensure you run your app with the --profile flag to minimize runtime performance differences from your final product.
14.3 DevTools
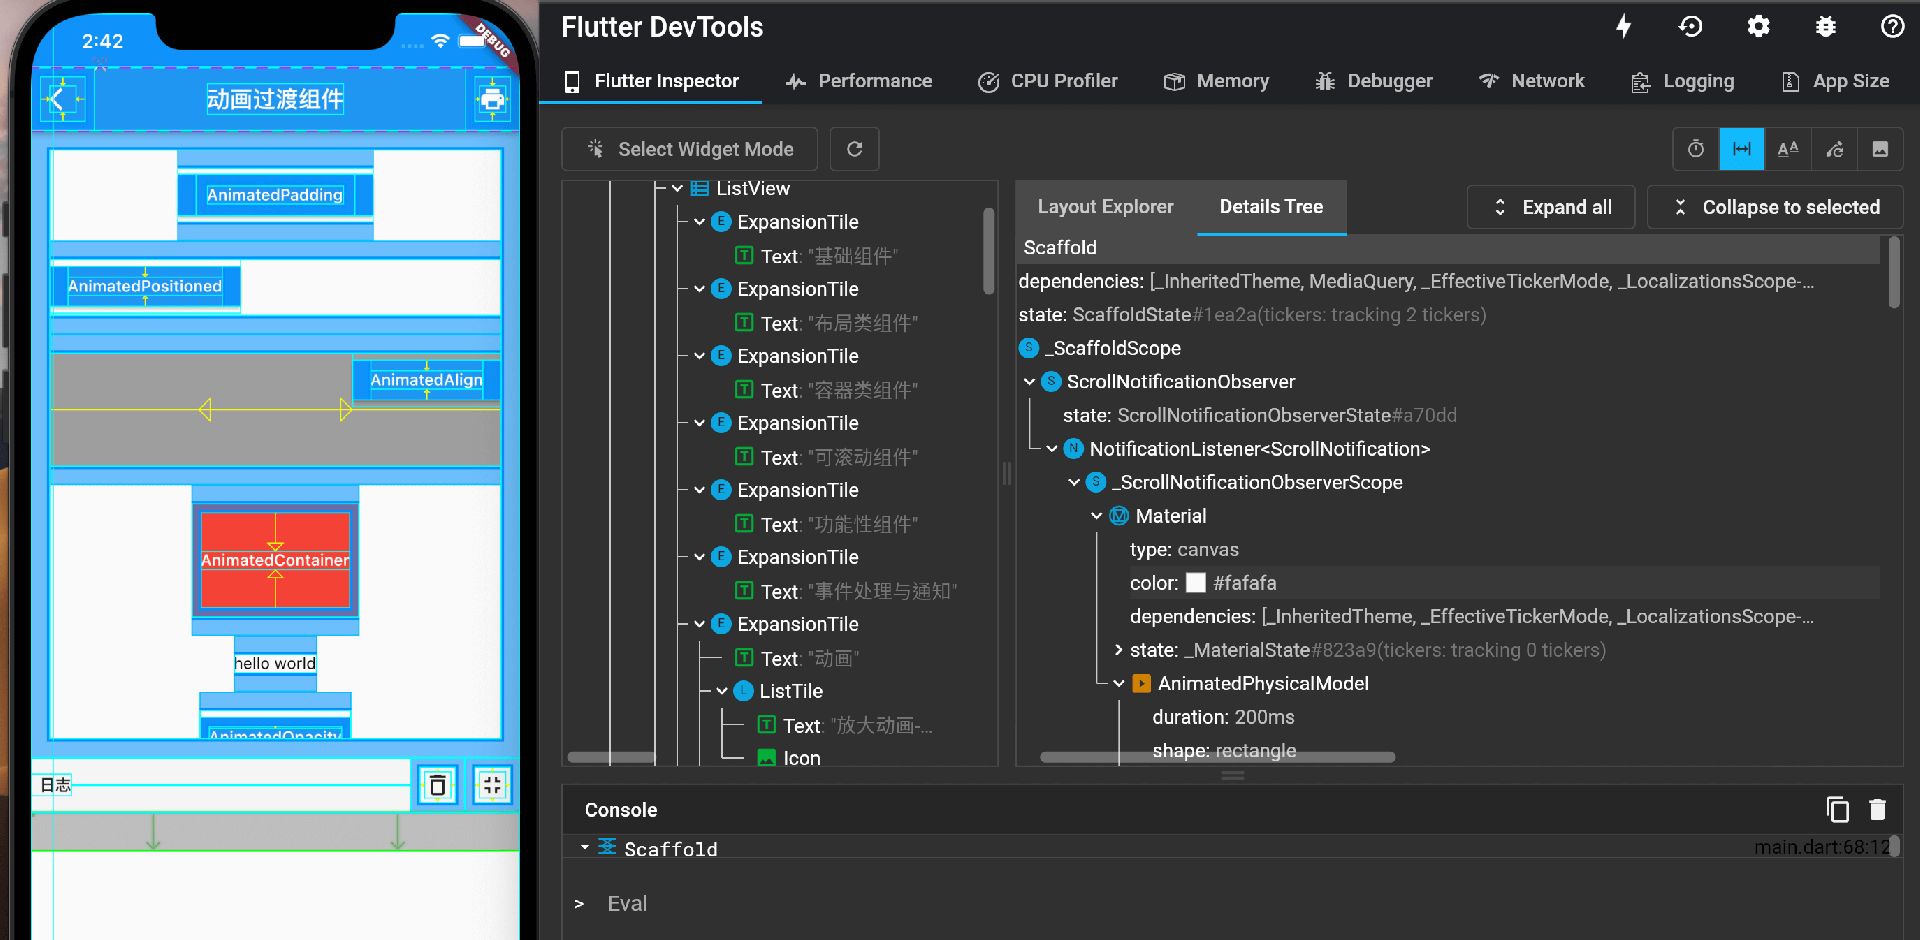
Flutter DevTools is a visual debugging tool for Flutter, as shown in Figure 2-20. It integrates various debugging tools and capabilities into a visual debugging interface. It's a powerful tool, and mastering it will greatly help with developing and optimizing Flutter applications. Since DevTools has many features that can’t be fully covered in a short introduction, this book will not provide a dedicated tutorial. For detailed instructions, readers can refer to the official Flutter website, which has comprehensive tutorials on DevTools.
