To determine whether a sample vehicle stops and waits at a specific red light, you first need to associate the two connected road segments at that traffic light. In other words, for a given traffic light, you can create one or more sets of related connected road segments, each set including two connected segments, where vehicles travel from the first segment to the second through the traffic light.
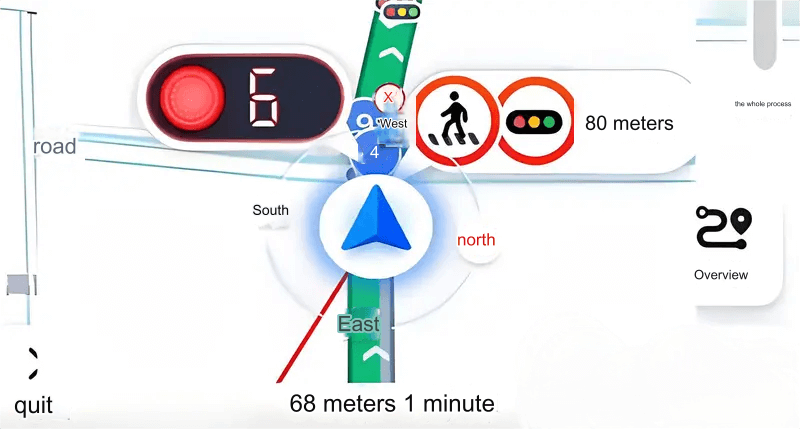
During my drive to smaller, fifth- or sixth-tier cities during the recent National Day holiday, I was surprised to find that the traffic light countdown feature in Amap (Gaode) remained quite accurate. Previously, I understood that the countdown feature in first- and second-tier cities relied on data from government traffic departments. But in smaller cities, the data might not be as comprehensive. So how does it still manage to provide countdowns? I looked into the relevant patents from Amap to understand the underlying principles.
The Principle Behind the Technology
Amap, being a major navigation provider, has access to large amounts of navigation data, which inherently follows patterns. According to Amap’s patents, the principle is as follows:
Read the target sample data;
Based on the trajectory data of the sample vehicles, identify the first vehicle that starts during the target time period;
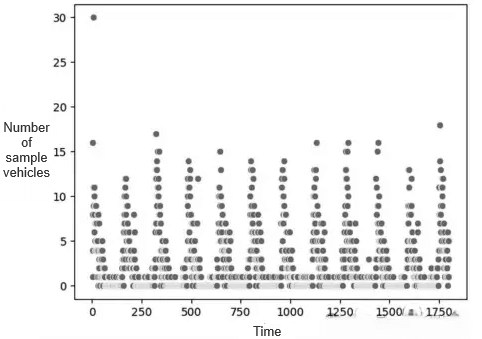
Take the starting time of that first vehicle as the start time and determine the time offset between the starting times of other sample vehicles within the same period;
Collect the distribution of these time offsets;
Use the periodic characteristics of this distribution to determine the cycle time of the target traffic light.
Challenges
While this process appears straightforward, several challenges still need to be addressed:
How to remove noisy data: Some vehicles, such as bicycles or scooters, may not follow traffic lights, leading to misleading data.
Handling multi-lane traffic lights: Different lanes may have different traffic light signals, but vehicle positioning accuracy isn't always precise, leading to potential misinterpretations of countdowns for different lanes.
Insufficient sample data at less busy intersections: How to deal with situations where there aren’t enough vehicles to generate reliable sample data?
Distinguishing traffic congestion from a traffic light: In cases of heavy traffic, a large number of waiting vehicles may lead to the system mistakenly identifying a traffic light where none exists. How do we filter out this cyclical congestion data?
Differentiating between single-phase and multi-phase traffic lights: Some traffic lights may have different wait times at different times of the day.
Solutions from Amap's Technical Details
How to filter out noisy data?
By using a pre-trained trajectory classification model, trajectory data can be classified into motor vehicle trajectories and non-motor vehicle trajectories.
Addressing multi-lane issues?
To determine whether sample vehicles are stopping and waiting at a target traffic light, the system associates two connected road segments. For each target traffic light, one or more sets of connected road segments are established, each set consisting of two connected road segments.
How to distinguish traffic congestion?
By segmenting the day into multiple time periods and analyzing the time vehicles stop at the target traffic light during each period, a filtering algorithm (such as a Discrete Fourier Transform) is applied. This makes it easier to identify stable cycles and remove congestion data.
Reference:Patent

